Introduction
In my journey to improve as a developer, I decided to dive deeper into dashboard UI/UX design. Creating beautiful and functional designs for yourself is one thing, but designing for others introduces new challenges. Everyone has different needs, preferences, and expectations, making it important to understand what makes a design truly user-friendly.
Let's take a closer look at user interface (UI) and user experience (UX) design, the principles behind good design, and how to apply them to dashboards where data, clarity, and efficiency play an important role.
What makes a good UI/UX?
Good UI/UX design combines beautiful, consistent visuals with usability, creating interfaces that are intuitive, efficient, and enjoyable to use. The goal is to help users navigate effortlessly, understand information quickly, and complete tasks without confusion.
A successful UI/UX design should focus on a few key principles:
- Simplicity: Clean layouts and minimal clutter, keeping the interface easy to understand.
- Intuitive navigation: Clear menus and logical structures help users find what they need.
- Visual hierarchy: Typography, spacing and contrast highlight important information.
- Consistency: Familiar design patterns create a predictable experience.
- Accessibility: Responsive and inclusive design ensures usability across devices and users.
- Clear data visualization: Well-structured charts and dashboards turn complex data into actionable insights.
The philosophy behind good design is simple: design should serve the user. Rather than adding unnecessary features or visual elements, good design focuses on functionality and clarity, allowing users to focus on their work instead of figuring out how the interface functions. But most importantly, always ask for feedback, because the best designs are shaped by the people who use them.
Recurring components in admin panels
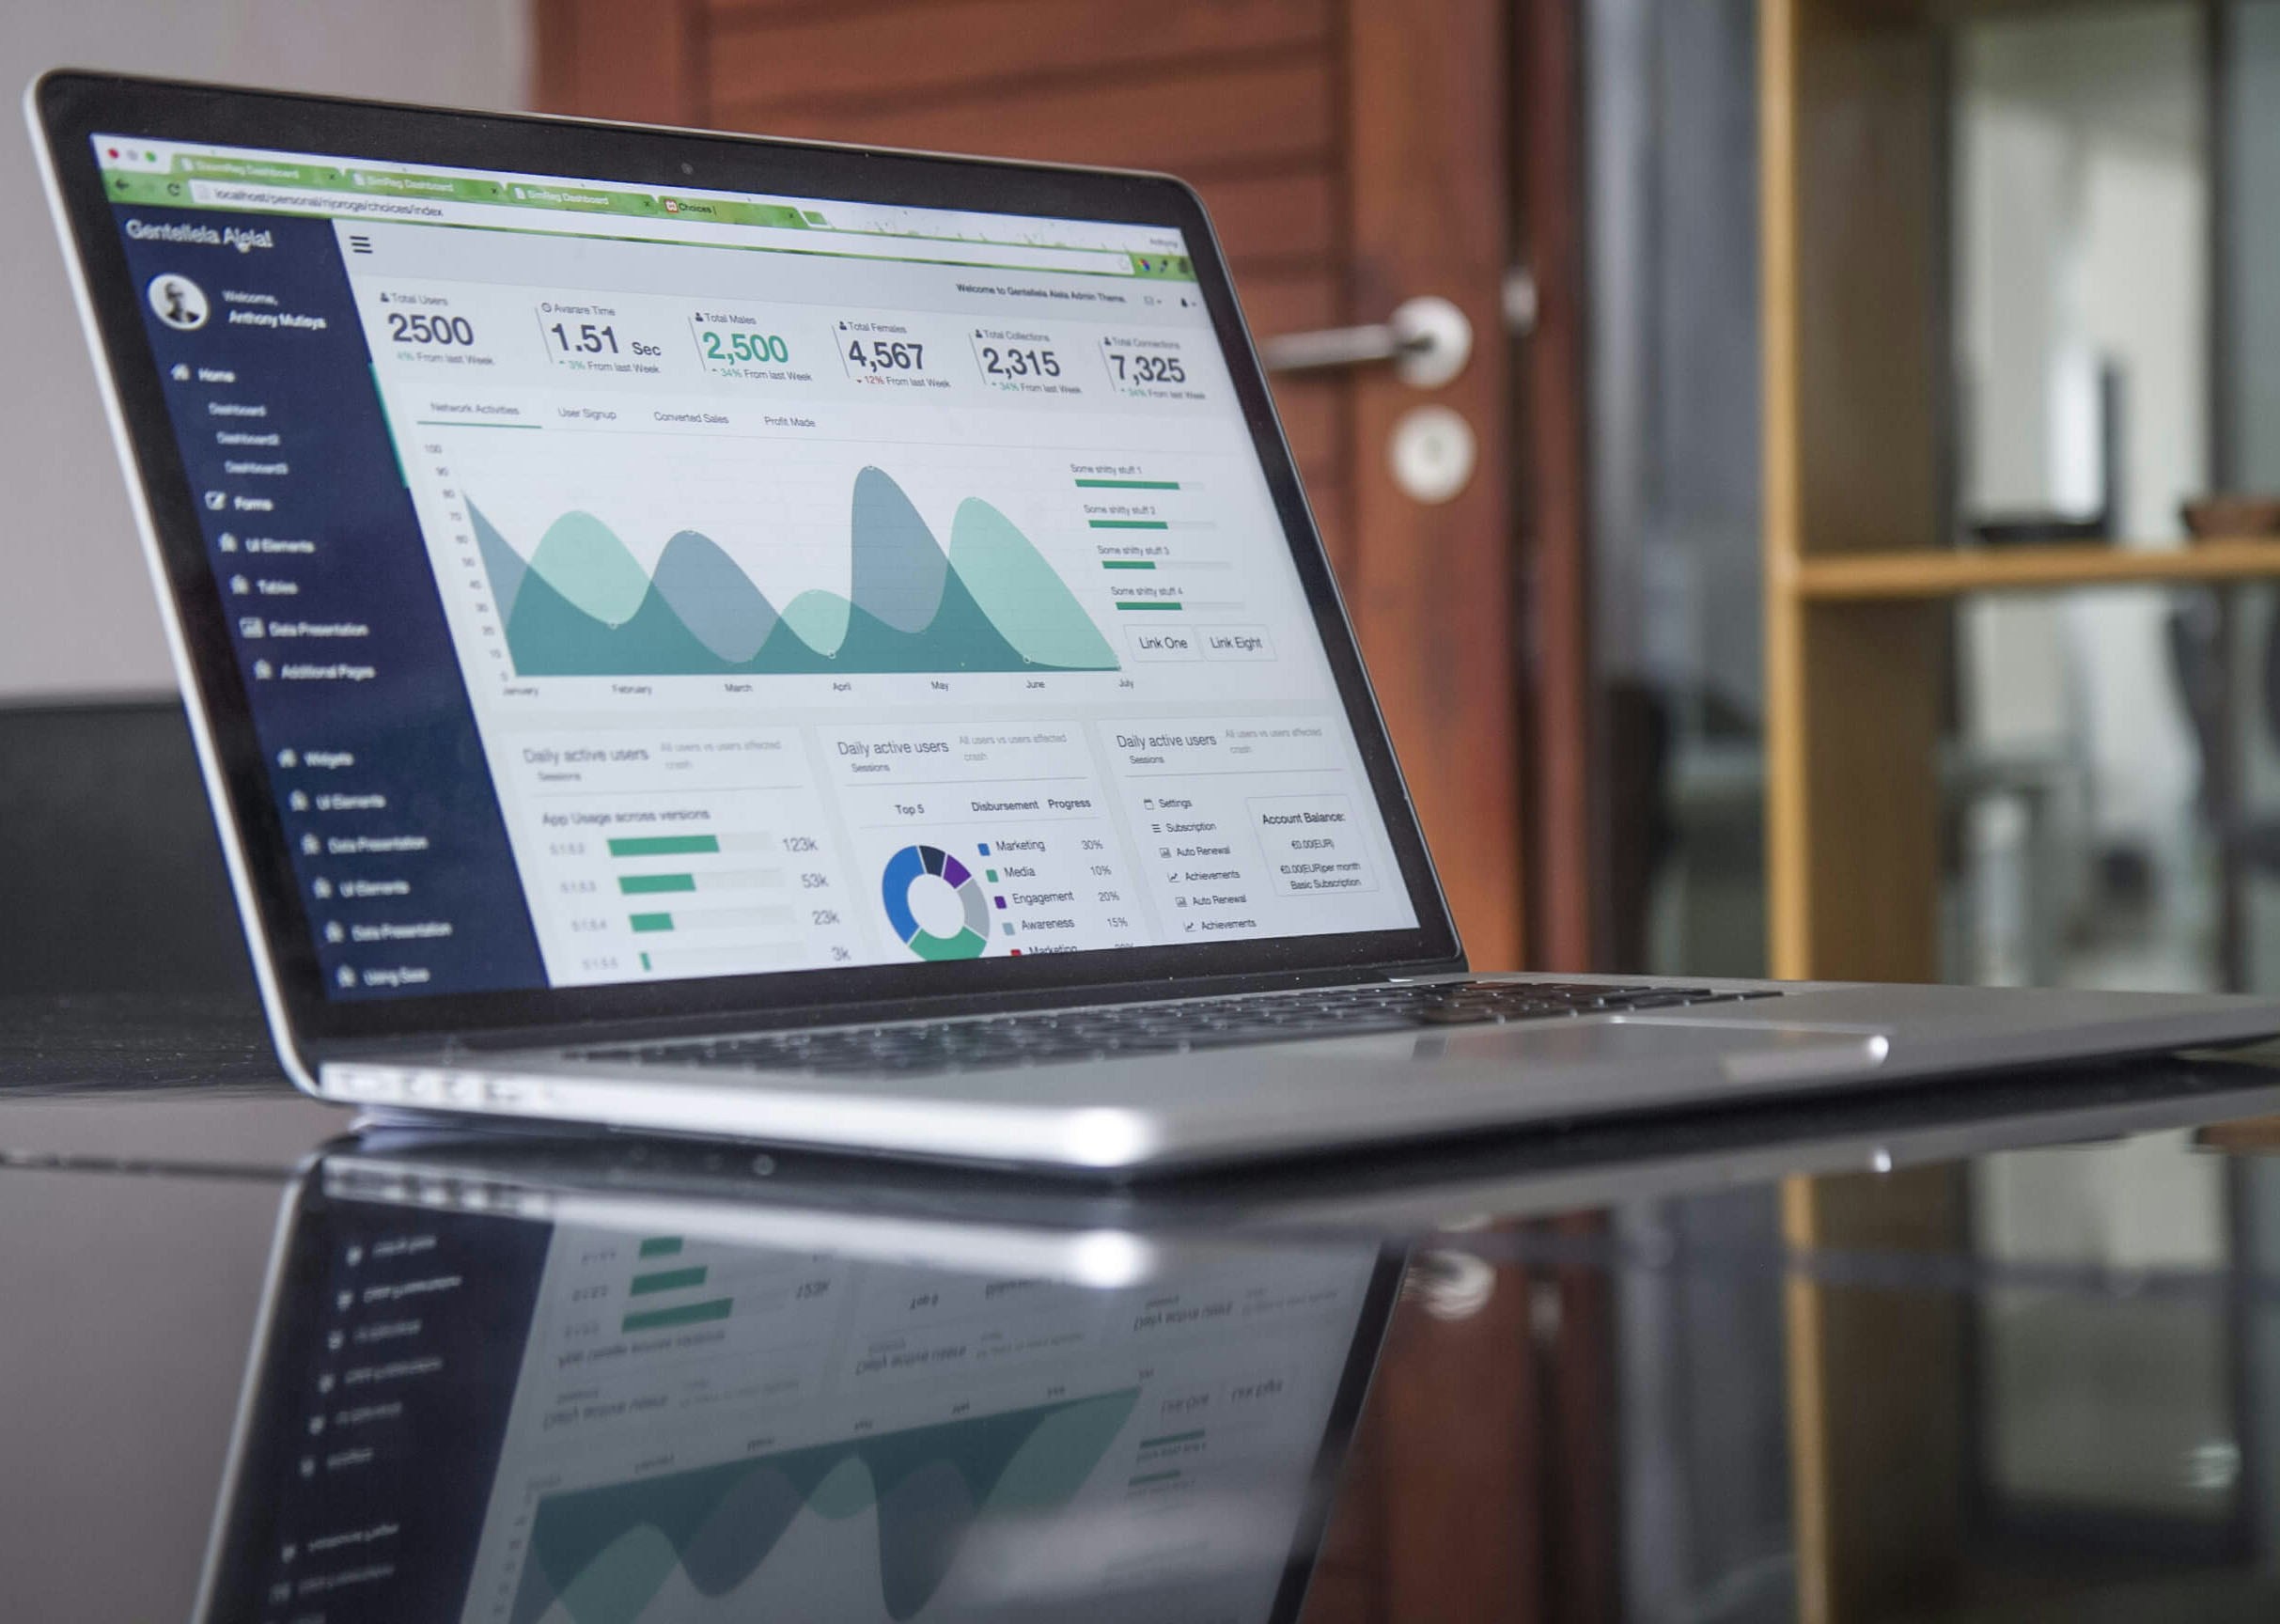
Most admin panels share similar layouts and components, making them familiar and easy to navigate. While the design may differ depending on its purpose, certain elements appear in almost every dashboard.
Sidebar
A default for a reason, sidebars provide a clear and structured way to navigate between different pages and features. Collapsible sidebars can also provide more room when needed. This commonly goes together with a minimalistic top navigation bar for search, user settings and actions like notifications, theme toggle, and other quick actions.
Cards
These are used to group or highlight important information, allowing users to understand important data at a glance.
Charts and Graphs
Turning complex data into understandable visuals. They help users identify trends, compare values and recognize patterns without having to analyze large amounts of raw data. Choosing the right visualization is important to avoid confusion.
Tables
Tables are essential for displaying structured data, especially when dealing with large amounts of information. They allow users to compare records, sort columns, filter results, and perform actions on individual entries. Well designed tables make managing data more efficient.
Tabs
Provide a simple way to organize related information into different sections. Allowing users to switch between views without navigating to another page. They help reduce the amount of information shown at once.
Breadcrumbs
For multi-level dashboards, breadcrumbs provide a clear navigation path, making it easier to understand where you are and return to previous pages.
Conclusion
Good UI/UX design is about finding the right balance between functionality, simplicity, and appearance. By understanding the principles behind good design and using familiar dashboard components, developers can create admin panels that are both visually appealing and efficient to use.
Ultimately, the goal is to make complex tasks feel simple and allow users to focus on what matters most.